Park & Ride Simulator
A Java Spring Boot microservices system — with Netflix Eureka, API Gateway, and Docker — simulating real-time parking sessions, smart billing, and role-based operator control.

Park & Ride Simulator (PRR)
Core Goal: Reduce urban traffic congestion and CO2 emissions by encouraging drivers to park at peripheral hubs and switch to public transport.
This project is a technical showcase of Distributed Systems, Microservices Architecture, and Full-Stack Development.
Technical Architecture
The system is built on the Spring Cloud Ecosystem (Java 21), orchestrated via Docker.
- Service Registry: Netflix Eureka.
- Gateway: Spring Cloud Gateway.
- Communication: OpenFeign (REST).
- Database: PostgreSQL (Containerized).
Phase 1: Onboarding (The Driver)
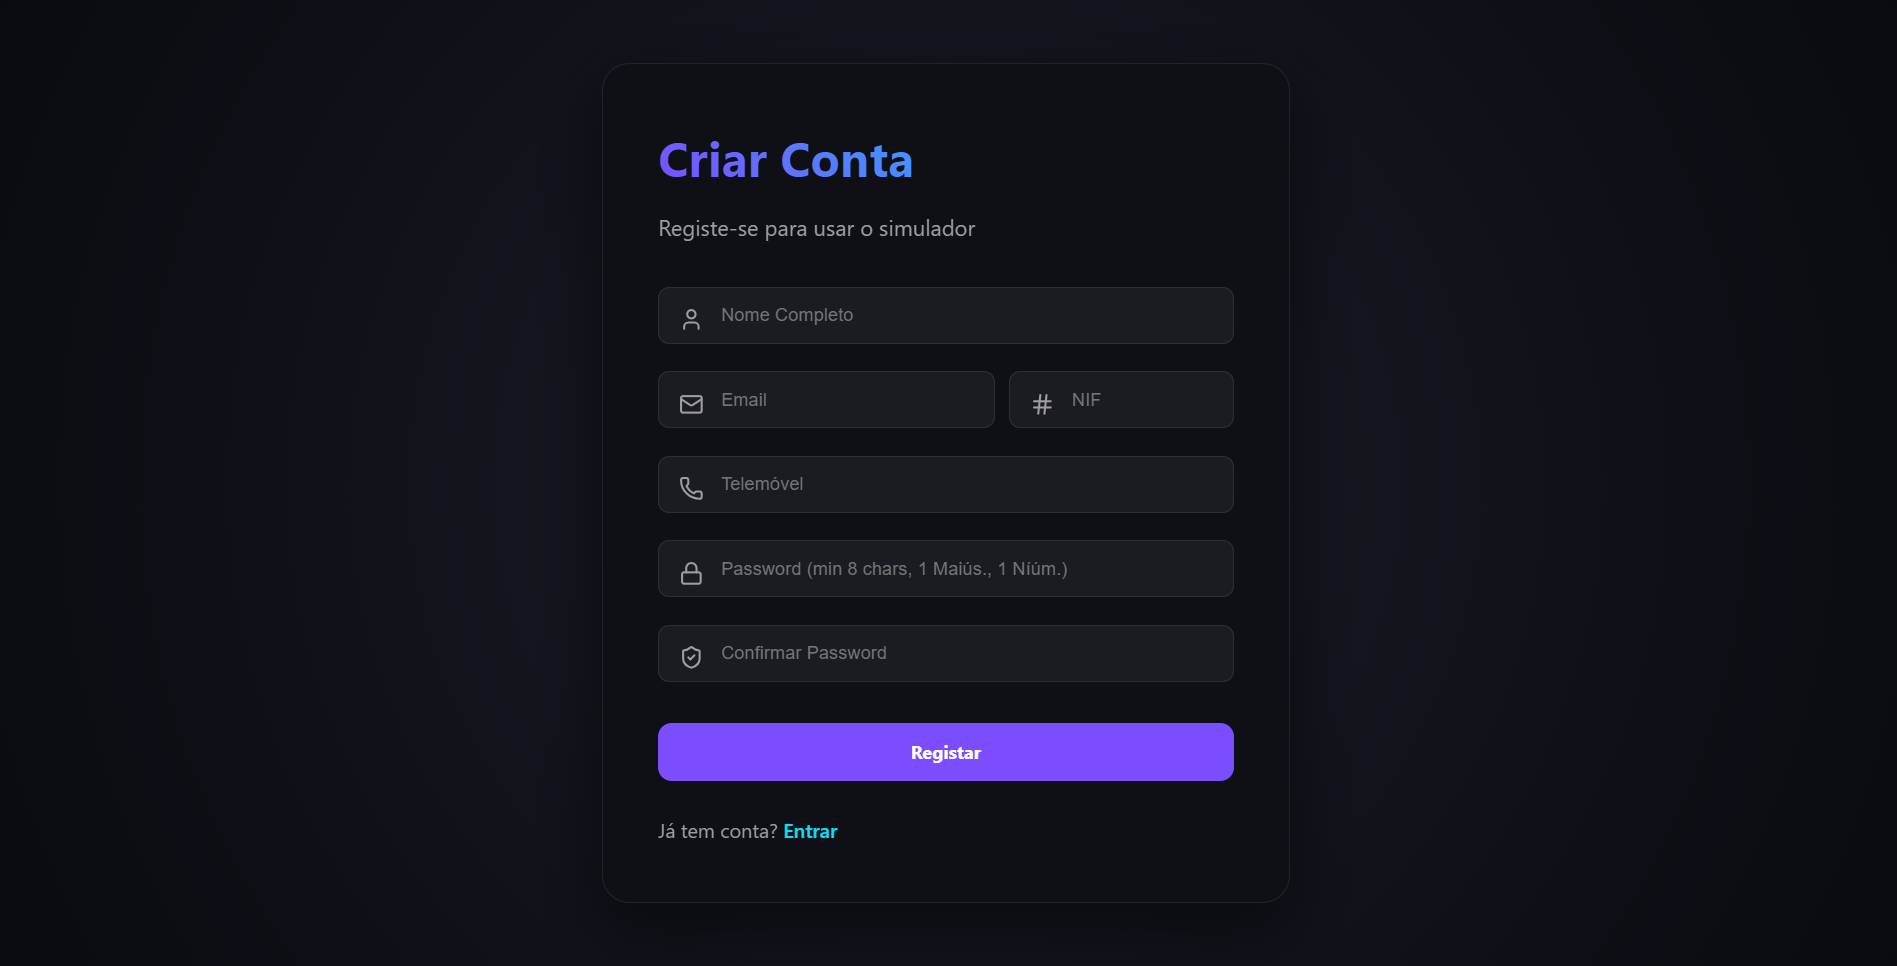
1. Registration & Identity
The system employs a secure JWT-based authentication flow. Users first create an account and then register their vehicles (license plates) to their profile.
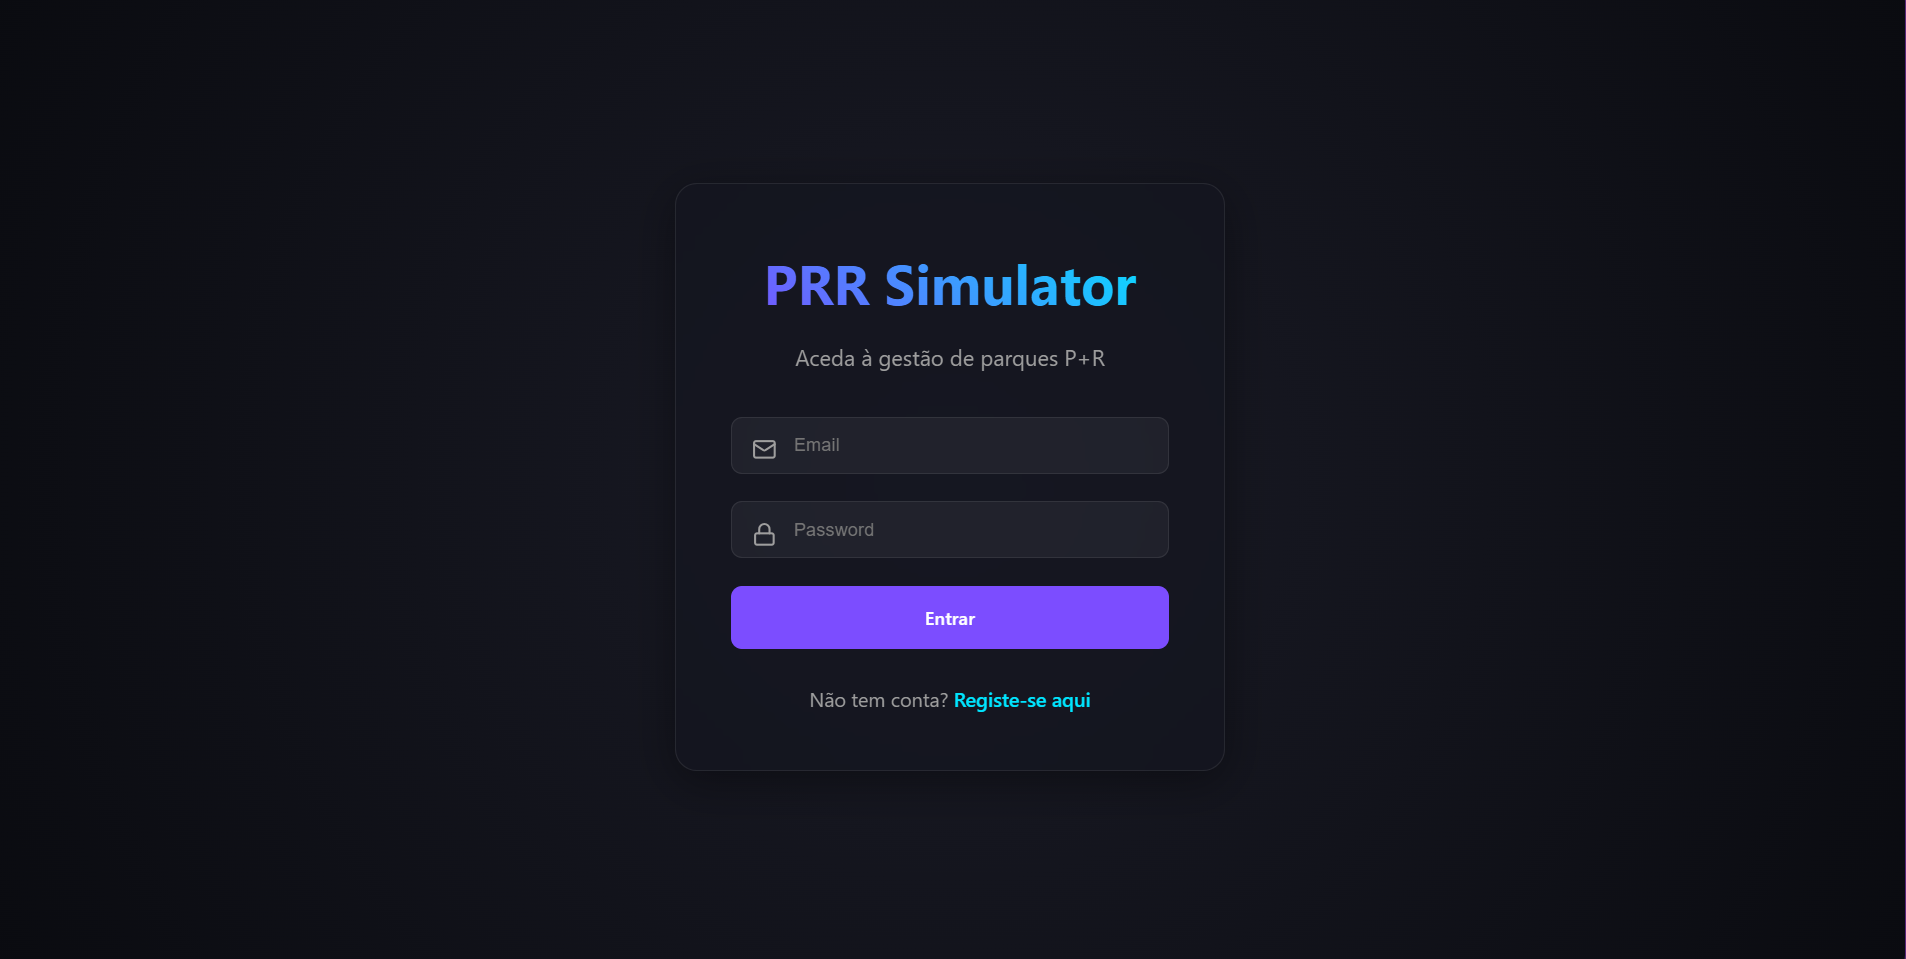
2. Authentication
Once registered, users log in to access the system. The API Gateway handles the routing and validation of credentials.
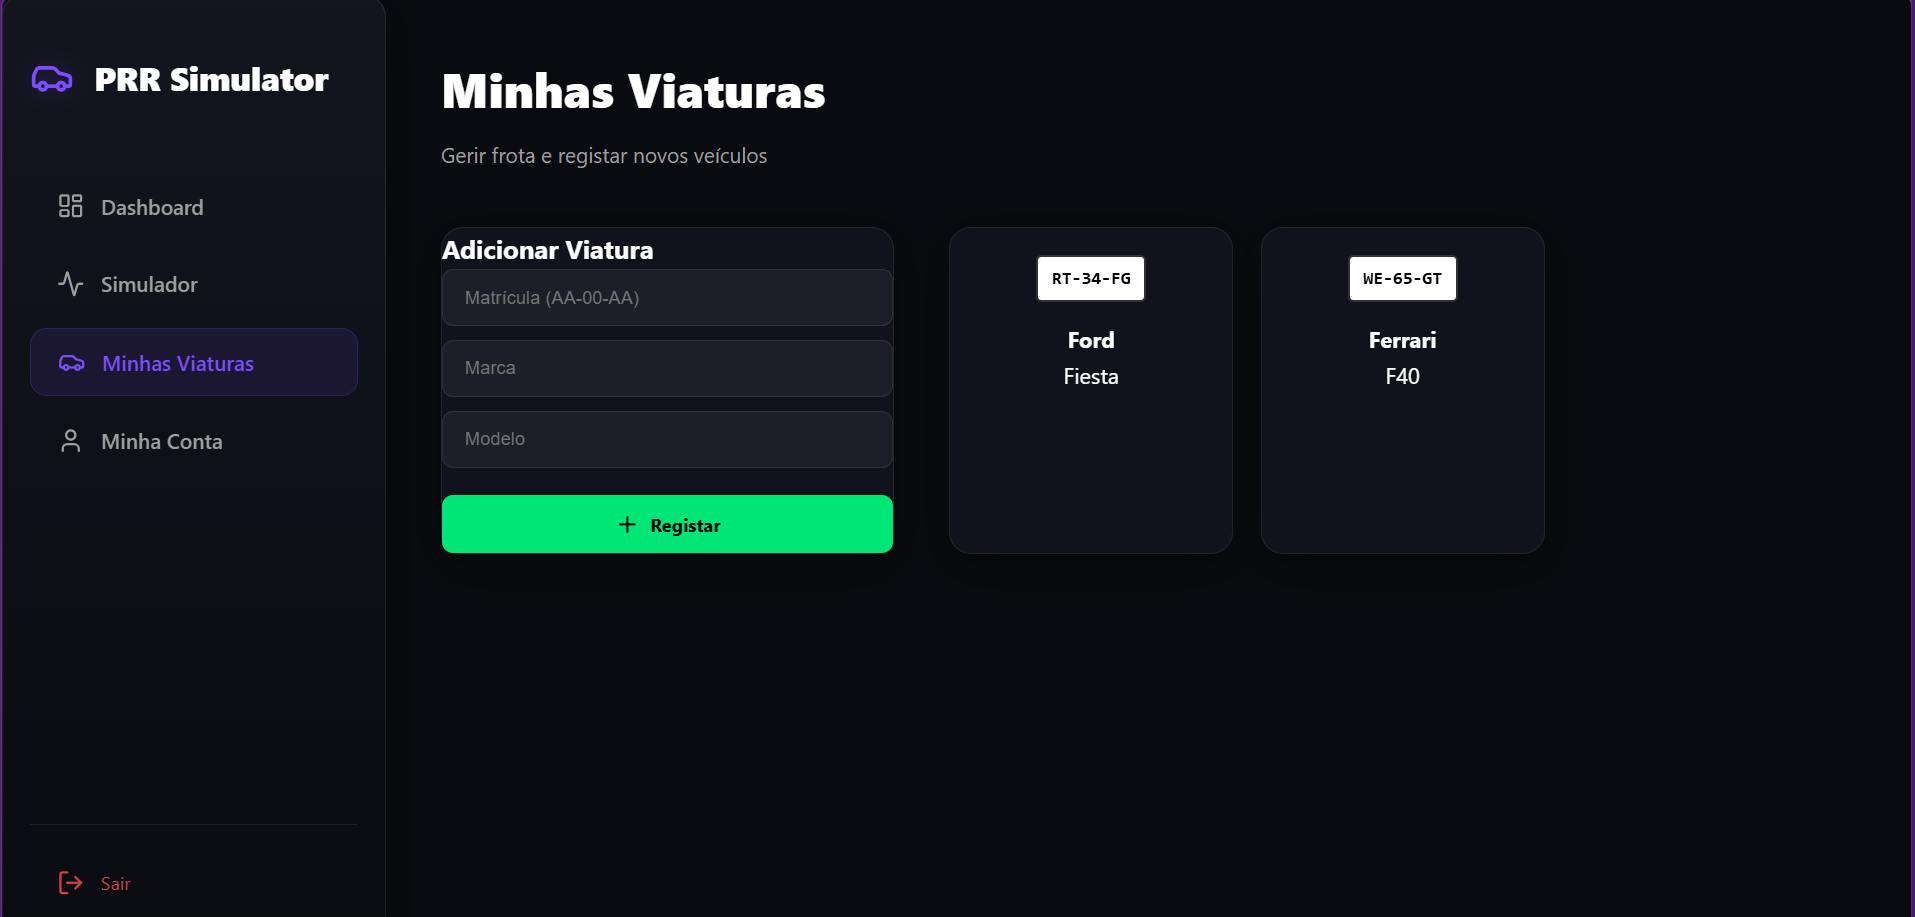
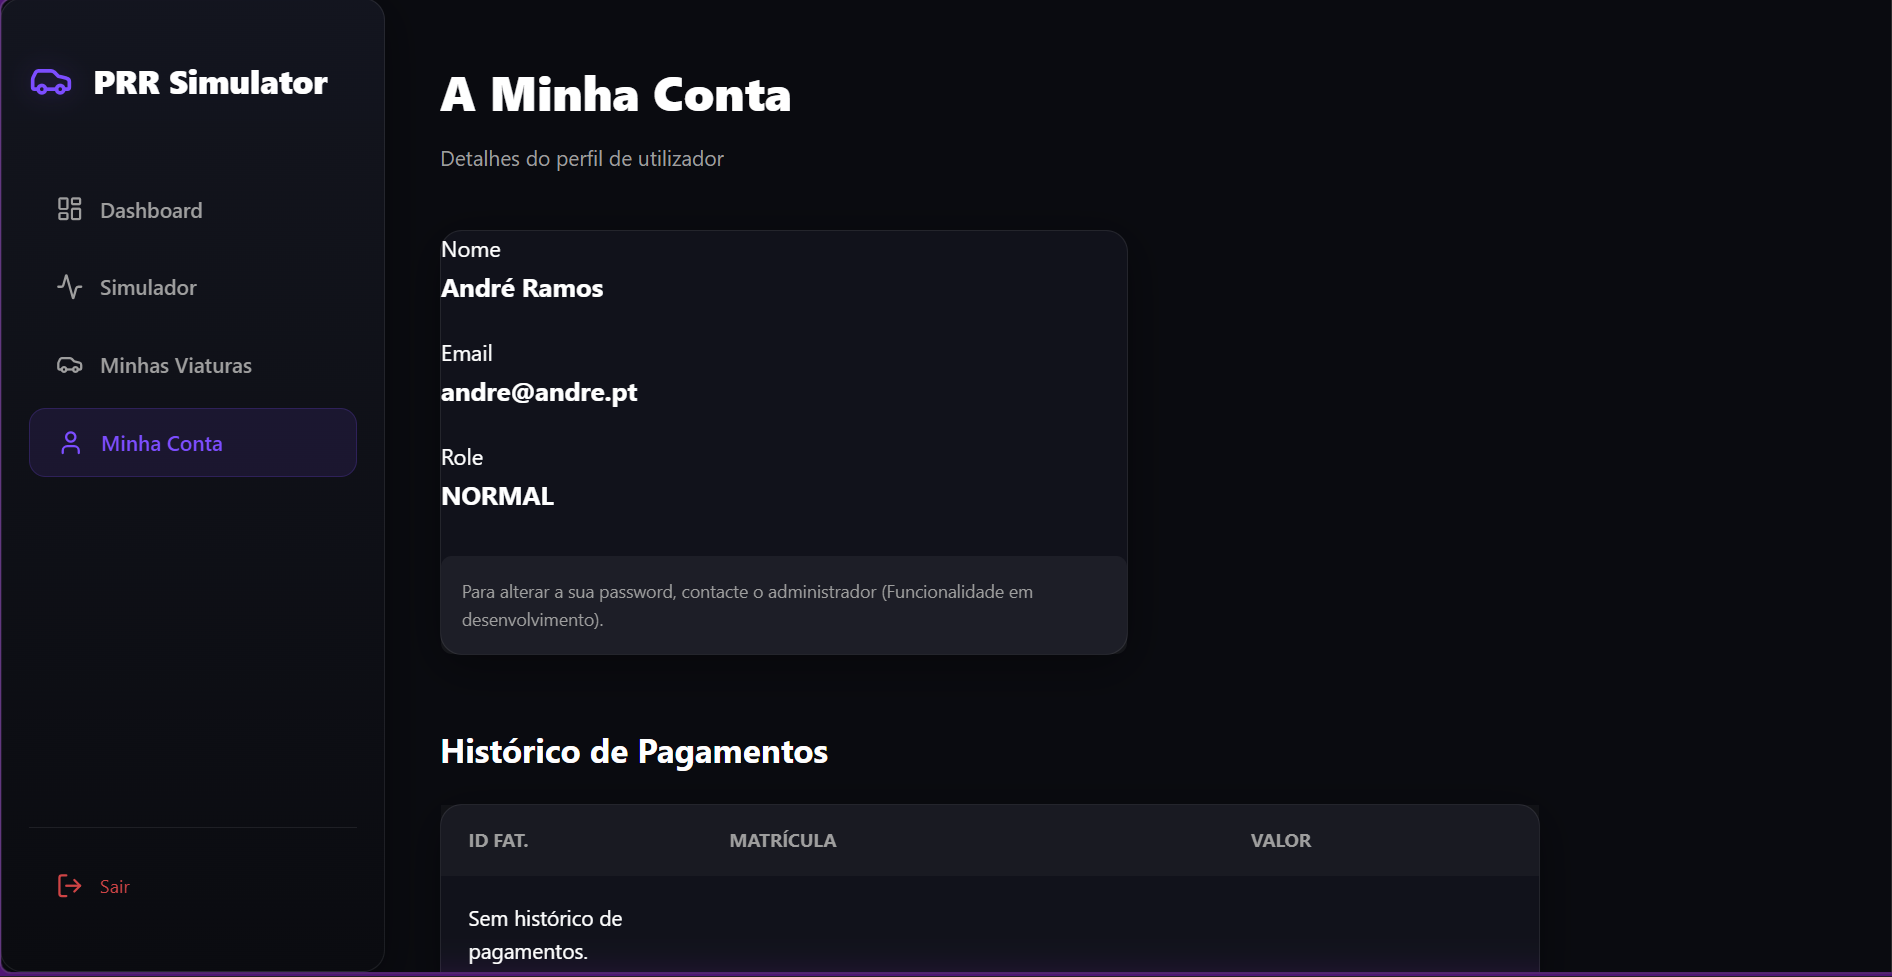
3. User Profile
Users can manage their fleet, view personal details, and verify their role status (User vs Operator vs Admin) from their profile page.
Phase 2: The Core Experience
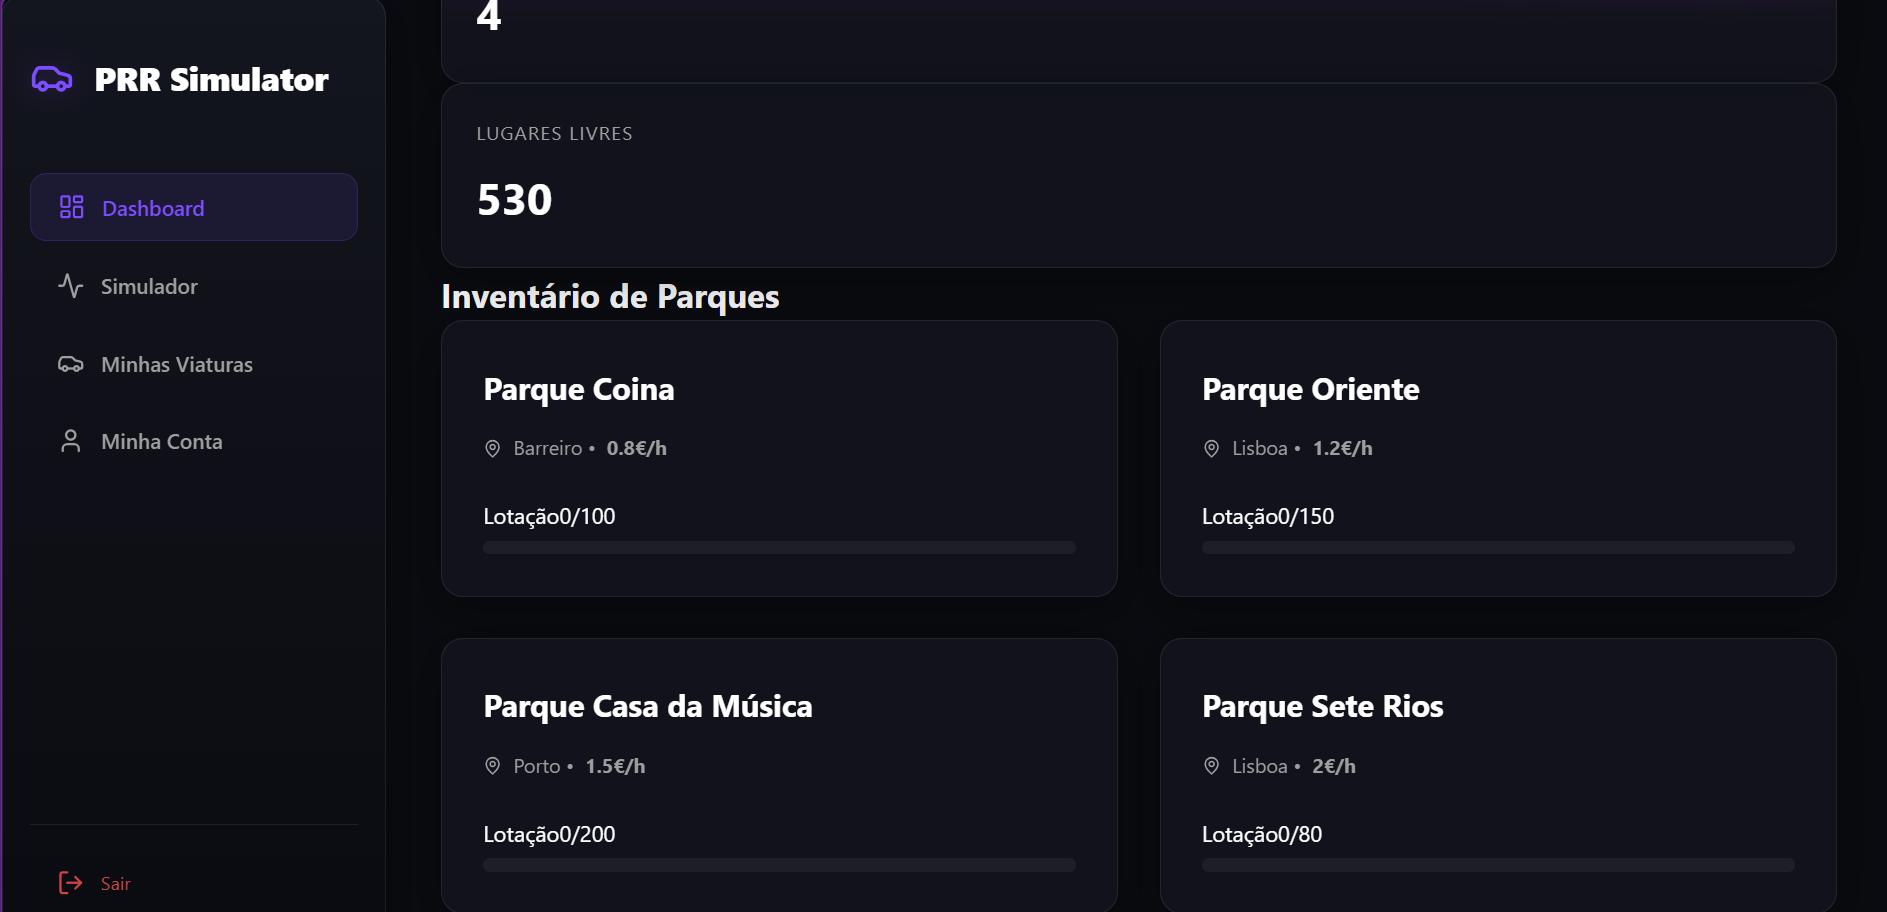
1. Real-Time Dashboard
Upon logging in, the user is greeted by a live dashboard showing the capacity of all peripheral parks. Green indicates available spots; Red indicates full capacity.
2. Simulation Engine (Check-In)
This is the heart of the simulator. A user selects a park and initiates a parking session ("Check In"). The Sessions Microservice begins tracking the duration in real-time.
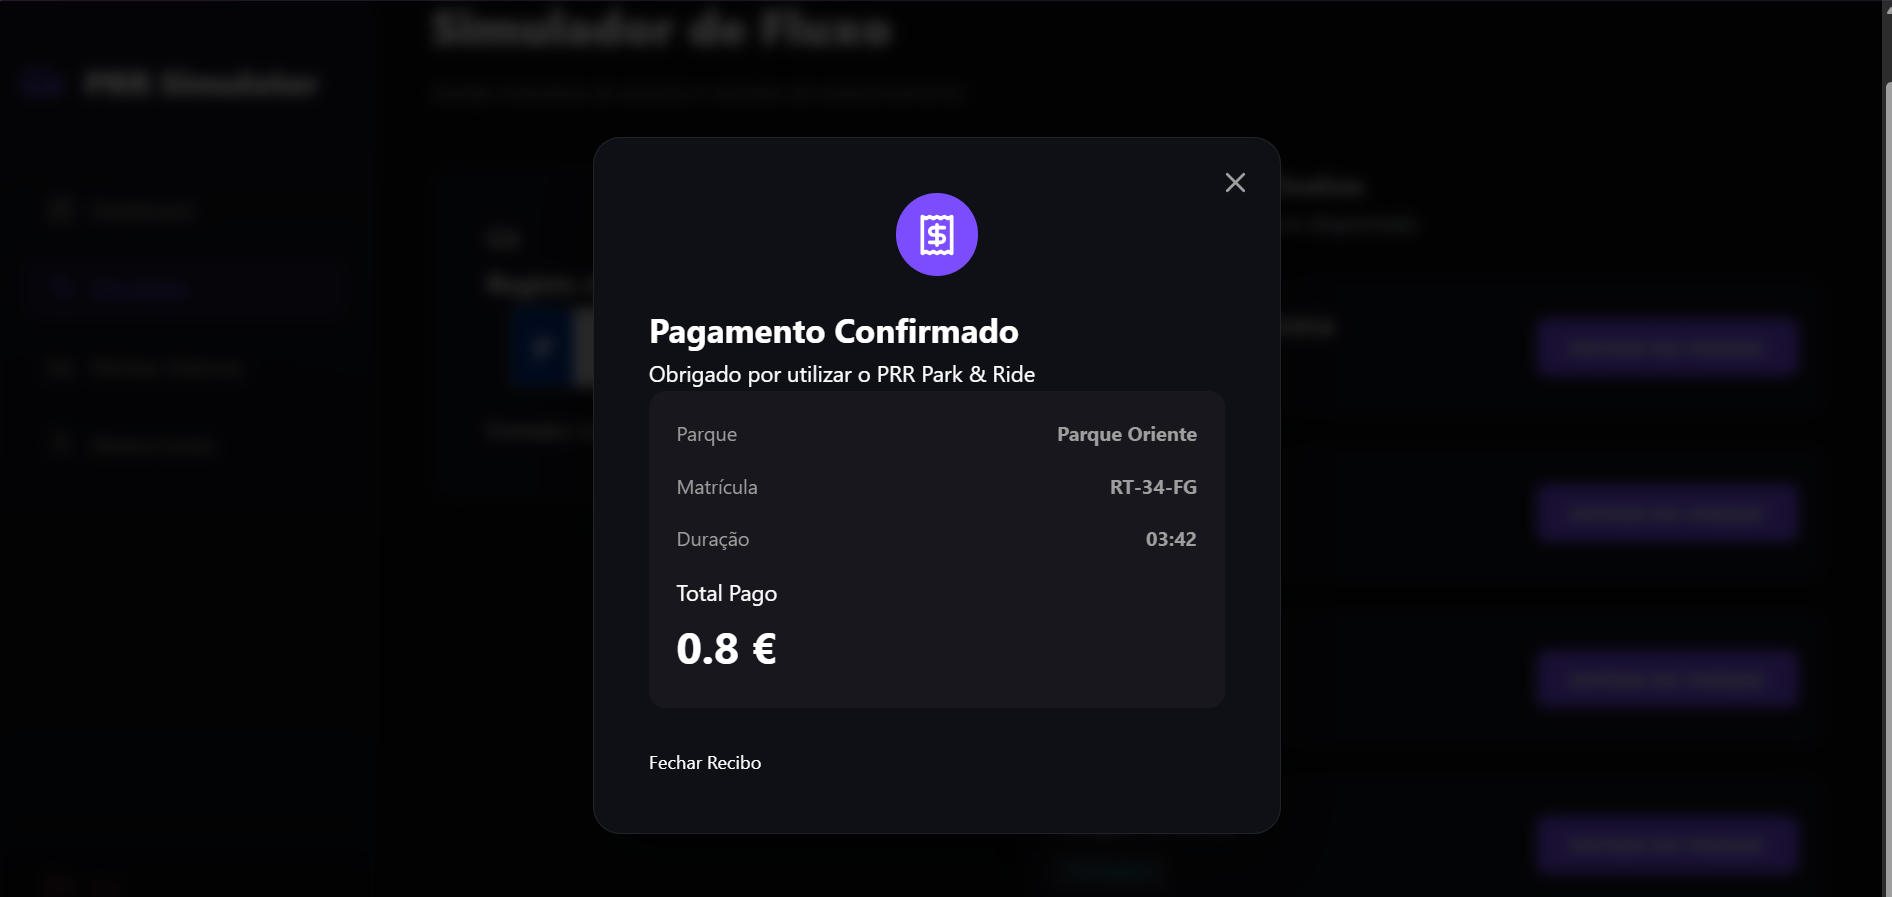
3. Smart Billing (Check-Out)
When the user "Checks Out", the Tariffs Microservice calculates the cost based on the exact duration and vehicle type, generating an instant digital invoice.
Phase 3: Operational Control
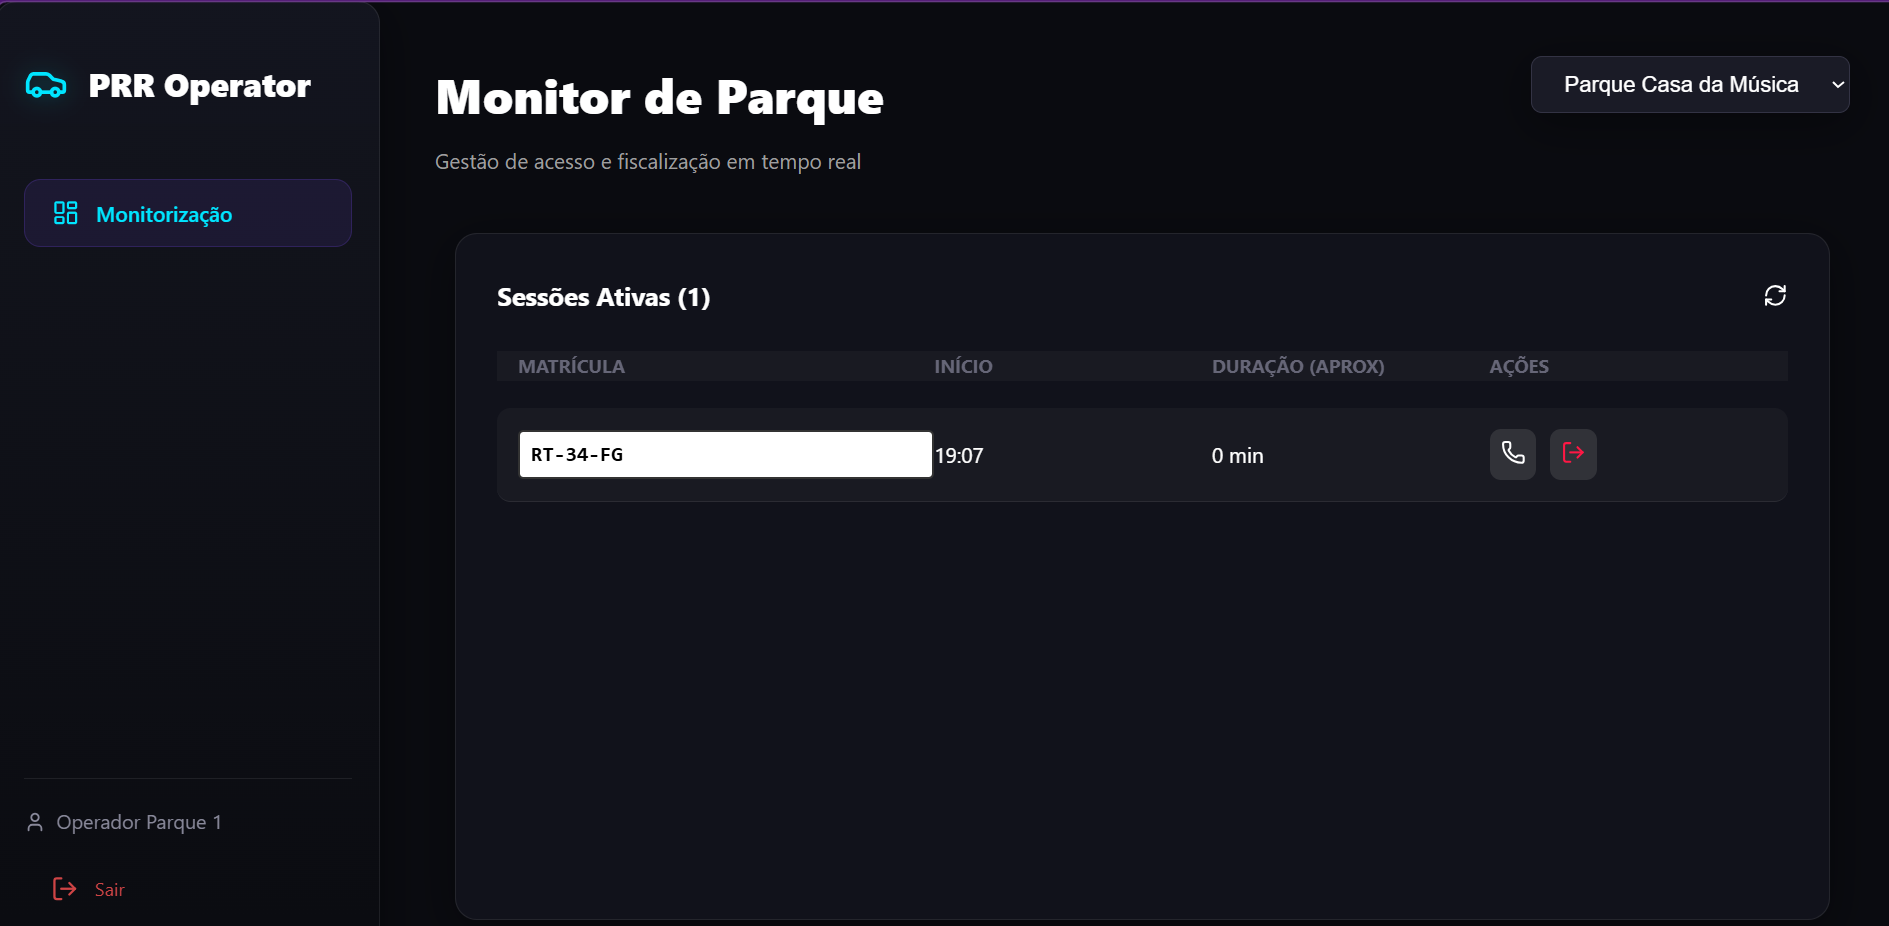
1. Operator Dashboard
Operators have a privileged view of the network. They can monitor real-time occupancy and manually Close or Open parks for maintenance or emergencies.
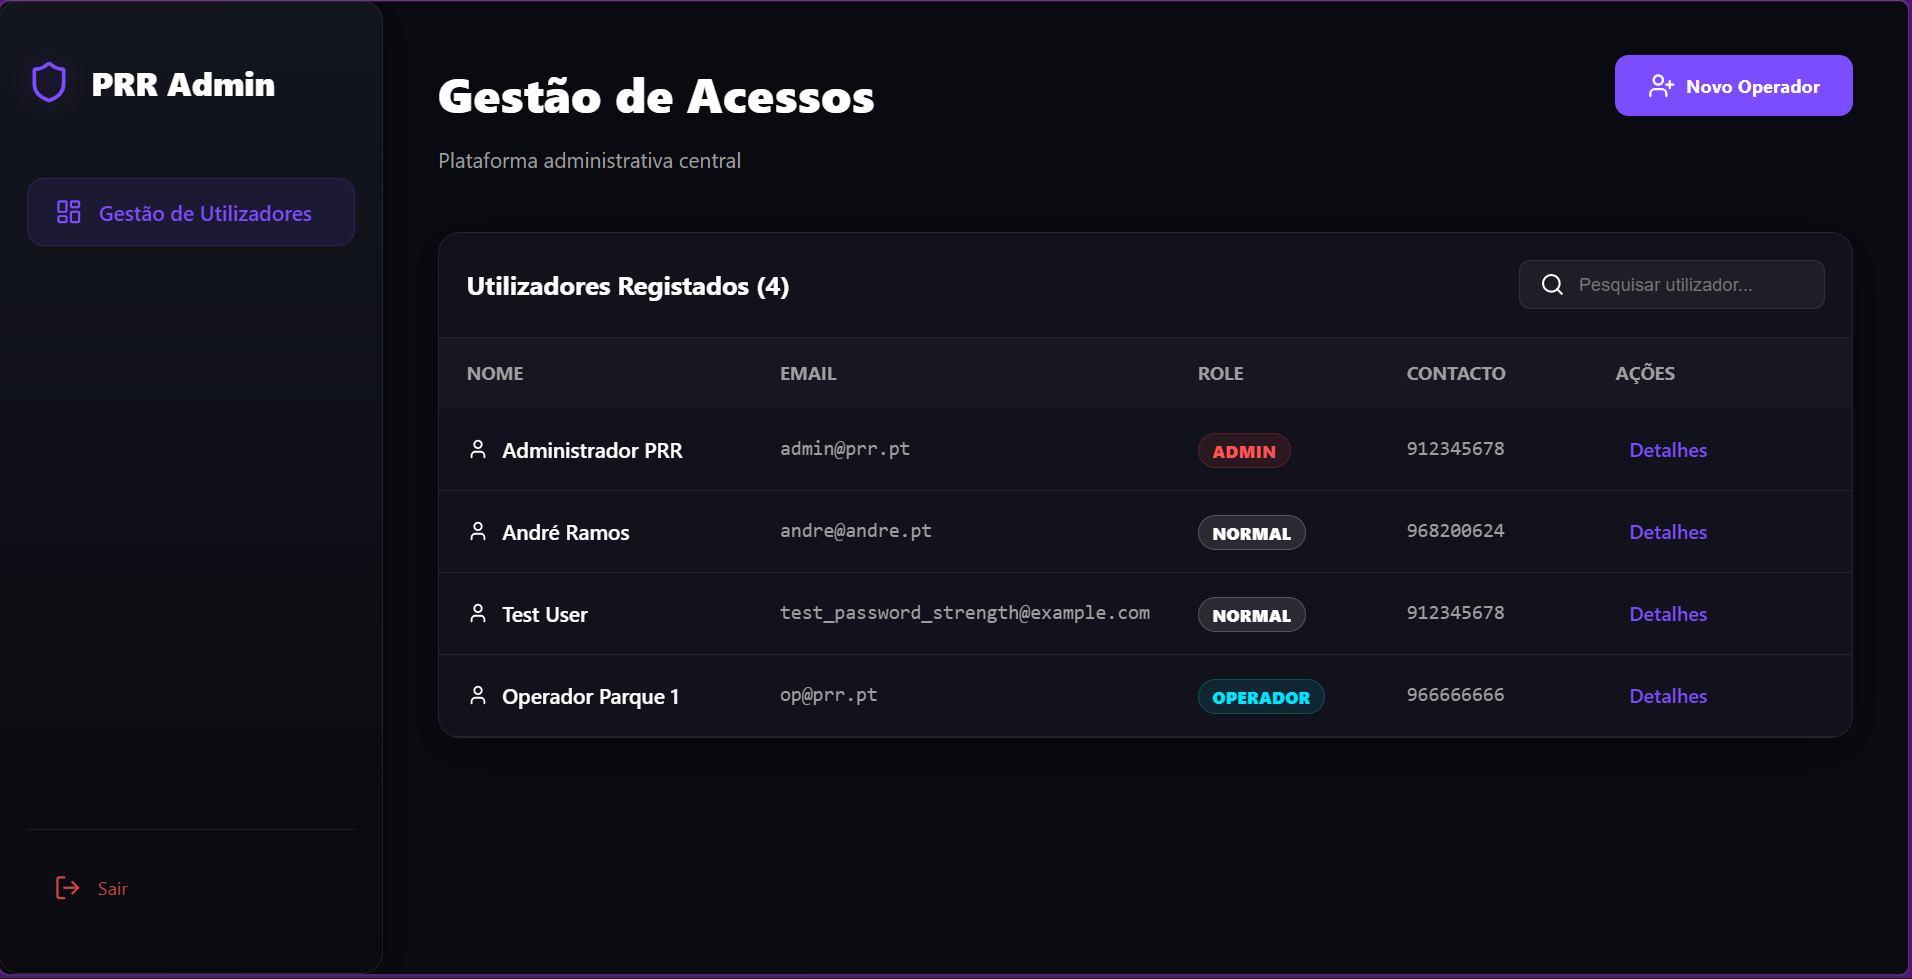
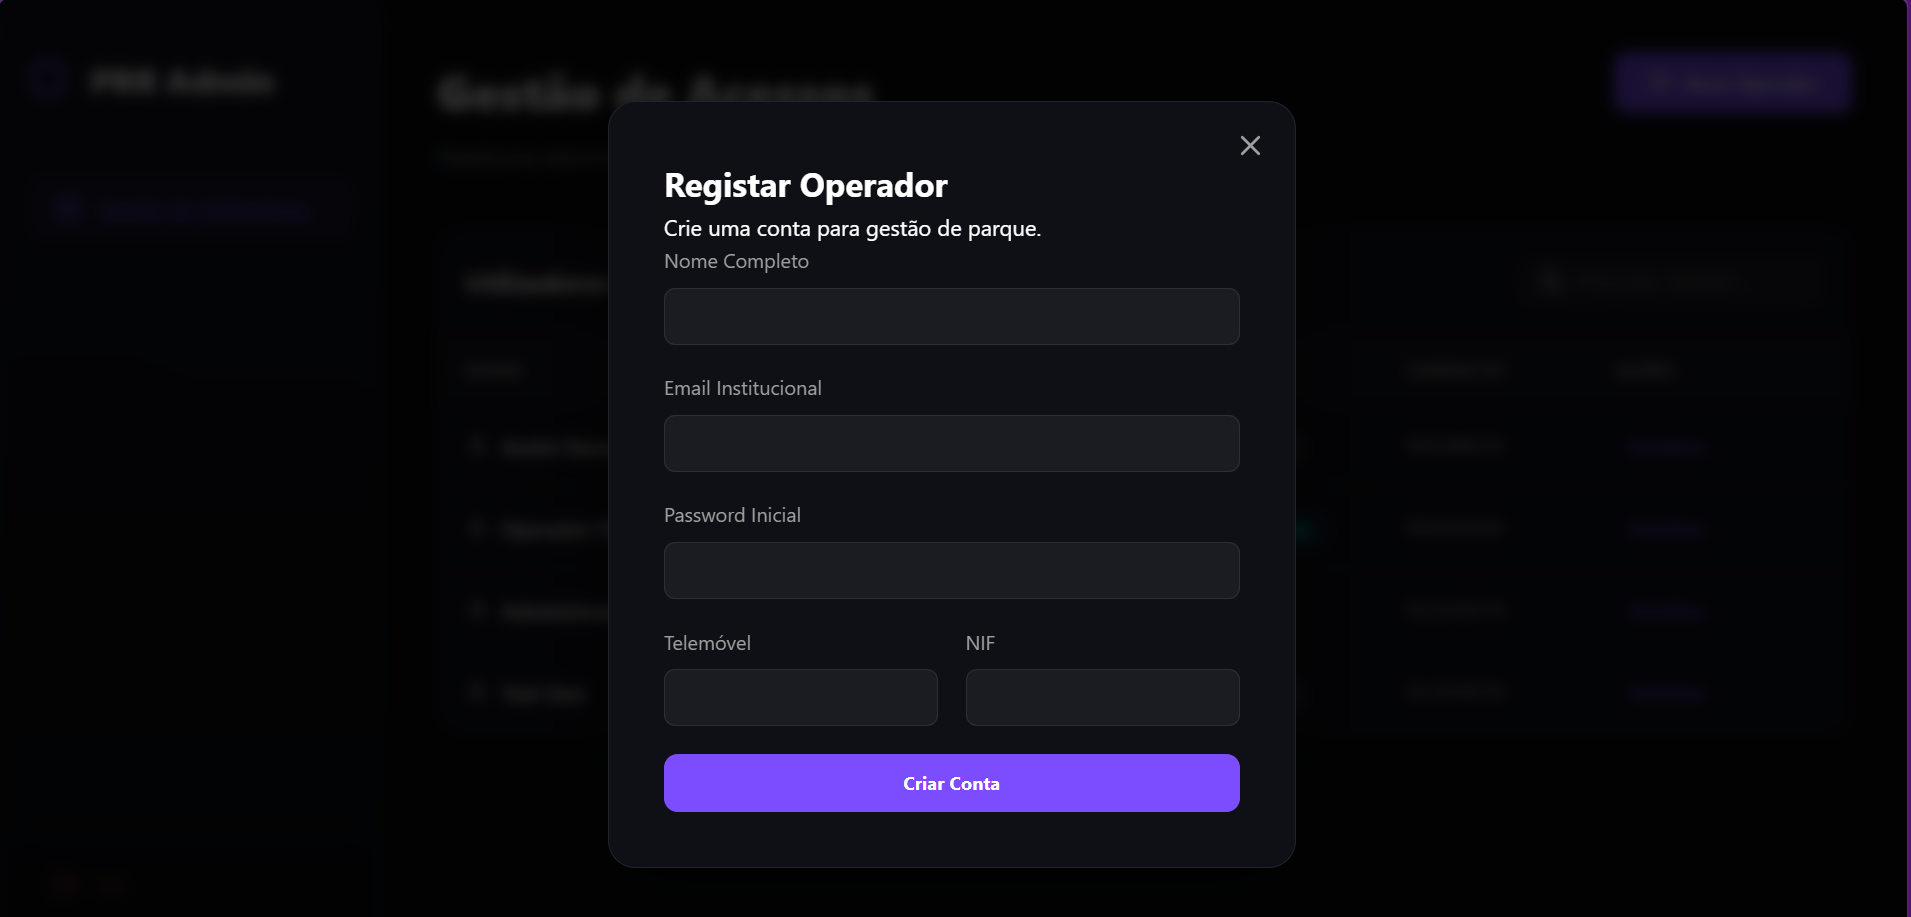
2. Operator Registration
The system supports distinct role onboarding. New operators can be registered with specific permissions to manage the infrastructure.
Phase 4: Administrative Intelligence
Network Analytics
Administrators have access to high-level metrics. The Analytics Microservice aggregates data from all other services to visualize total revenue, network health, and usage trends.